The trade-off in one curve
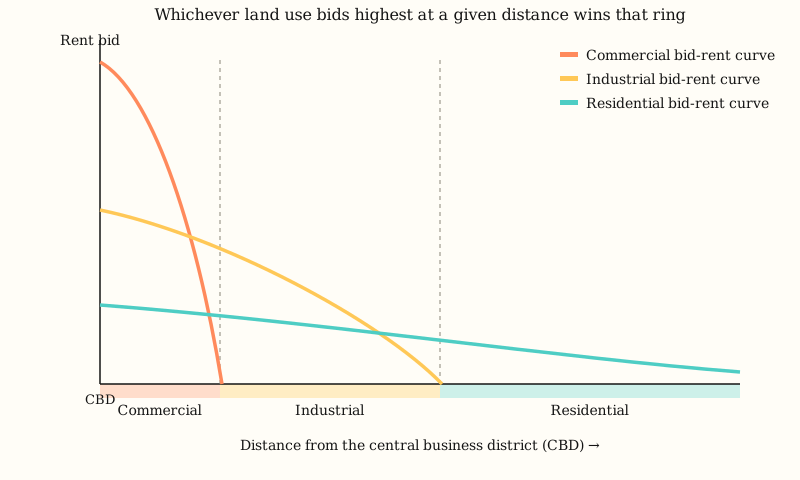
Every plot of urban land has more than one potential buyer, and bid-rent theory is really just an answer to what those buyers are willing to pay for it. A retailer wants to be as close to the central business district as possible, because foot traffic and visibility there translate directly into sales, so a retailer's "bid-rent curve" starts high near the CBD and drops steeply with distance. A factory owner cares less about foot traffic and more about shipping costs and floor space, so an industrial bid-rent curve starts lower but drops more gently. A household cares about commuting time, but is willing to trade a longer commute for a bigger yard, so a residential bid-rent curve starts lowest of all and declines slowest, stretching furthest from the center before it flattens toward zero.
Plot all three curves on the same graph, distance from the CBD on the horizontal axis and rent a user is willing to bid on the vertical axis, and the land-use pattern falls directly out of the geometry: at any given distance, whichever curve sits highest wins that ring of land, because that's the user who can outbid everyone else for it. Near the center, the retail curve is highest, so downtown becomes commercial. A little further out, the industrial curve overtakes it, producing a belt of factories and warehouses. Beyond that, the residential curve is the last one still paying anything, so housing takes over. The theory doesn't need to describe any specific building or street; it only needs to say that whichever use bids the most at a given radius gets that radius, and repeat that logic across every ring.
A farm idea, borrowed twice
The mathematics behind bid-rent theory didn't start out urban at all. According to Wikipedia's summary of the theory's origins, the first theorist to describe a bid-rent effect was the classical economist David Ricardo, who argued in the early 1800s that rent on the most productive farmland reflects its advantage over the least productive land available, with competition among farmers ensuring landlords capture that advantage as rent. The Prussian economist and farm owner Johann Heinrich von Thünen turned that observation into a full spatial model in his 1826 book Der isolierte Staat (The Isolated State), showing that a single ring of one crop after another would form around a market town purely because transport costs eat into a farmer's profit at a rate that differs crop by crop, so the crop that can least afford a long haul claims the land closest to town.
It took more than a century for an economist to point that same logic at cities, not farms. William Alonso, working at Harvard, published Location and Land Use: Toward a General Theory of Land Rent in 1964, explicitly generalizing von Thünen's ring-of-crops model into a ring-of-land-uses model for a modern metropolis, with the central business district standing in for von Thünen's market town. The underlying bid-rent function Alonso derived expresses, for any given household or firm, the maximum rent per unit of land it can pay at a given distance while still achieving a target level of profit or utility once commuting costs are subtracted, the formal version of the same "how much am I willing to give up on the commute" trade-off every renter runs informally when apartment-hunting.
The pandemic gave the model a real test
A theory built on a trade-off between commuting cost and land cost makes a sharp, testable prediction: if commuting costs suddenly collapse for a large share of a city's workforce, the bid-rent curve should flatten, because the whole reason downtown land commanded a premium was that it saved a commute nobody has to make anymore. That's close to what happened in 2020. Stanford economists Arjun Ramani and Nicholas Bloom documented it in a National Bureau of Economic Research working paper they titled "The Donut Effect of Covid-19 on Cities": using US Postal Service change-of-address data and Zillow rental listings, they found that rent growth in the central business districts of the twelve largest US metros ran about 15 percentage points behind rent growth in the least-dense half of American zip codes, and that those CBDs lost about 9 percent of their population and 16 percent of their business establishments beyond what pre-pandemic trends would predict, while the least-dense zip codes gained roughly 1 to 2 percent on both measures over the same stretch.
Ramani and Bloom's own framing ties the finding directly back to the theory: widespread remote work reduced the daily cost of living far from a job, so the bid-rent curve for residential land flattened, pulling relative demand, and relative rent, out toward the suburbs and exurbs. They called the resulting pattern, a hollowed-out center ringed by growth further out, the "donut effect." It wasn't permanent. As offices reopened and hybrid-work arrangements settled into a stable minority of the workforce rather than a majority, the steepest part of the exodus reversed somewhat after 2022, though most housing-market analyses since then describe the shift as a partial correction rather than a full return to the pre-2020 curve, real evidence that the underlying trade-off, and not just habit or inertia, was driving where the money went.
Why real cities don't draw one clean curve
Bid-rent theory's textbook diagram assumes something no real metro area fully satisfies: a single central business district that every commuter is trying to reach, sitting on a flat, featureless plain with transportation costs that rise evenly in every direction. Los Angeles is the standard counterexample. The metro area has no single dominant downtown that every bid-rent curve radiates from; instead it has several independently competitive commercial centers, Downtown LA, Century City, and the cluster of tech and media firms sometimes called Silicon Beach among them, each with its own local rent gradient rather than one shared curve. Research on Chicago, the same city Ernest Burgess used to build the concentric zone model which describes urban invasion and succession, has similarly found the metro area fits a polycentric structure with multiple employment centers better than a single-CBD model.
That gap between the clean single-curve diagram and the messier reality isn't unique to bid-rent theory among the geography classroom's spatial models. Walter Christaller's central place theory makes a comparably strong simplifying assumption, that a market has one threshold size and one travel-distance limit, and later reviewers found it explains the geometry of trade areas better than it explains how individual shoppers actually choose where to go. The trade-off between land cost and transport cost remains useful in more complicated models, but it does not explain every influence on rents or urban land use.